
Let’s Talk Stats
Let’s look at season ending stats and compare to where the teams were when the season started.
This past season saw more changes as we split into two divisions and allowed players to cross rosters in both divisions. We had a total of 255 registered players, of which 22 players (9.4%) registered on two teams. Of the 22 players, half did better in NL league than in AL League in terms of batting average. We didn’t count one of the dual registered players because he played on 2 NL teams. The rest of the stats show better performance in the NL: 13 did better in OBP, 12 did better in SLG, and 13 did better OPS. The data makes sense seeing that there would be more errors in the NL league.
Last season, we had 1 division with 13 teams. This season, we had 2 divisions with 16 teams.
The following estimated end of season points are based on OPS only and not the actual multiple rigorous screening processes that your (unpaid) committee goes through. Did I mention the committee doesn’t get paid? In the off season, the committee will once again gather and have multiple long, late night discussions to fine tune ALL the rankings in time for the next softball season and for teams to develop their rosters. Before I forget, I need to disclose…..the committee does not get paid to do any of this work.
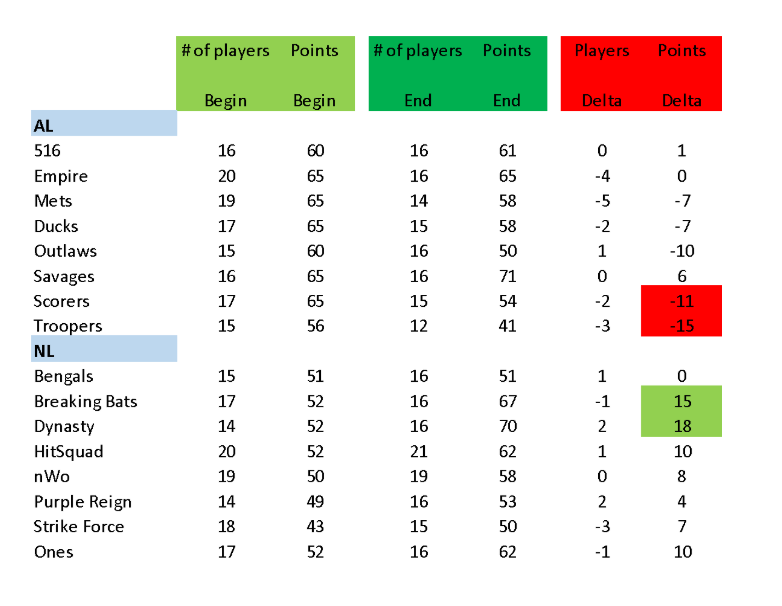
The team with the highest season ending points:
Surprise Surprise…..Savages with 71 points
The team with the least season ending points:
Troopers with 41 points BUT also with the smallest active roster size in the season
The most improved team:
Dynasty who started the season with 52 points and ending with 70 points.
The most unimproved team:
Troopers who started the season with 56 points and dropping to 41 points.
Before anyone blows up Ammad’s and Anwar’s phones or the whatsapp boards…..remember that the end of season points displayed are based on OPS ONLY and have not been audited by the committee, which means a player who had 1 AB all season and hit a single could have a high OPS number causing a high rank score.
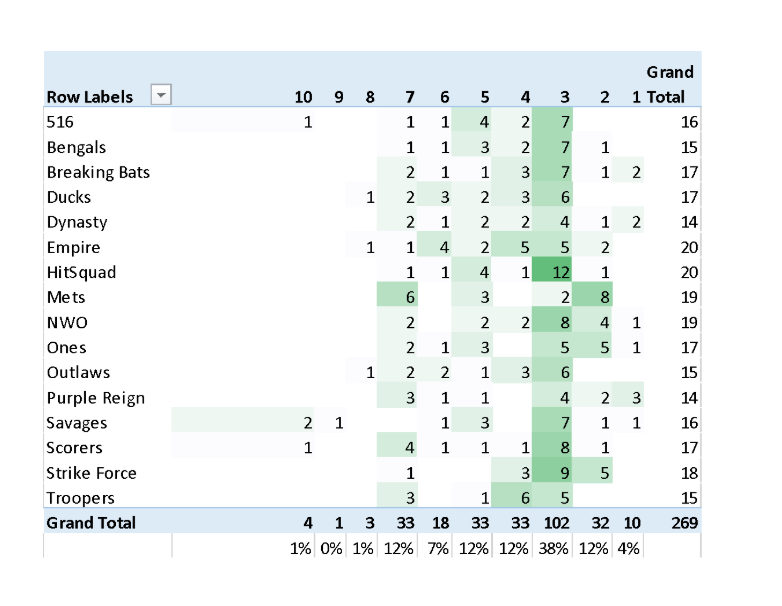
Moving on……let’s take a look at season ending rank spreads (based on OPS alone):
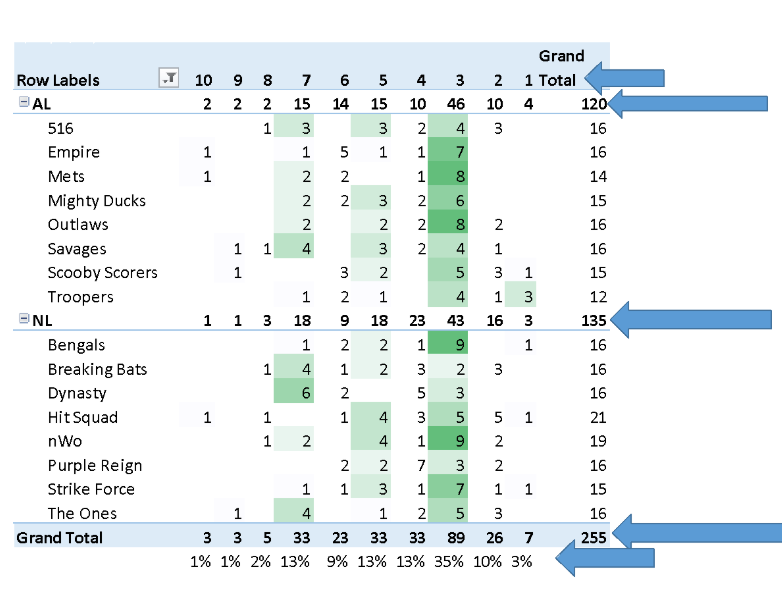
…..and here’s where the teams were at the beginning of the season:
My prediction at the beginning of the season was Savages, Scorers, Mets, and Hit Squad in Playoffs based on player spreads.
Spreading the talent and staying under the points cap was a strategic exercise that every team had to endure. Remember that the focus of this exercise is to bring parity to each of the divisions and at the same time, develop talent by spreading it around. We are all part of the same community and should remember that all decisions made by the committee are in the best interest of maintaining the longevity and reputation of our SASL league.